
Tiedosto:Logarithmic functions.svg

Tämän PNG-esikatselun koko koskien SVG-tiedostoa: 600 × 480 kuvapistettä. Muut resoluutiot: 300 × 240 kuvapistettä | 960 × 768 kuvapistettä | 1 280 × 1 024 kuvapistettä | 2 560 × 2 048 kuvapistettä.
Alkuperäinen tiedosto (SVG-tiedosto; oletustarkkuus 600 × 480 kuvapistettä; tiedostokoko 27 KiB)
Yhteenveto
| Kuvaus |
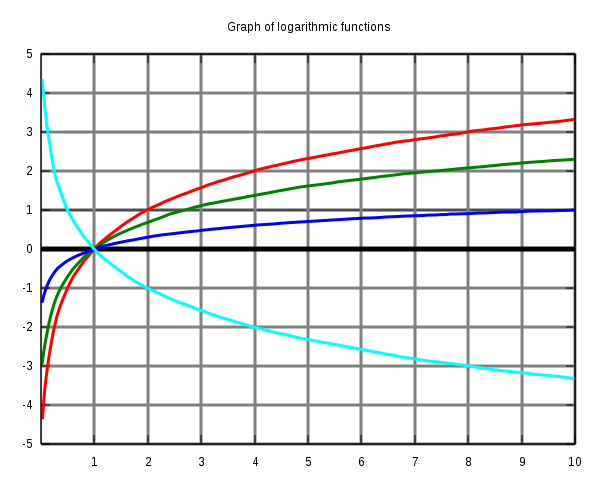
Graph of logarithmic functions in SVG-format. Red is log(x) base 2. Green is ln(x) (log(x) base e). Blue is log(x) base 10. Cyan is log(x) base 0.5.
set terminal svg set output "logarithm.svg" set title "Graph of logarithmic functions" set xrange [0:10] set yrange [-5:5] set xtics 1,1,10 set ytics -5,1,5 set grid linewidth 3 set xzeroaxis linewidth 5 plot log10(x)/log10(2) notitle with lines linewidth 3, log(x) notitle with lines linewidth 3, log10(x) notitle with lines linewidth 3, log10(x)/log10(0.5) notitle with lines linewidth 3 show output |
| Päiväys | |
| Lähde | Oma teos |
| Tekijä | Christoffer Stausland |
Lisenssi
Minä, tämän teoksen tekijänoikeuksien haltija, julkaisen täten tämän teoksen seuraavilla lisensseillä:

|
Voit kopioida, levittää ja/tai muuttaa tätä asiakirjaa GNU Free Documentation License -lisenssin version 1.2 tai minkä tahansa Free Software Foundationin julkaiseman myöhemmän version ehtojen alaisena; ei koske muuttumattomia kohtia, etukannen tekstejä eikä takakannen tekstejä. Kopio tästä lisenssistä on saatavilla osiossa GNU Free Documentation License. |
| Tämä tiedosto on lisensoitu Creative Commons Nimeä-JaaSamoin 3.0 Ei sovitettu -lisenssillä. | ||
| ||
| Lisensointimerkintä lisätiin tähän tiedostoon osana GFDL-lisensointipäivitystä. |
Tämä tiedosto on lisensoitu Creative Commons Nimeä-JaaSamoin 2.5 Yleinen, 2.0 Yleinen ja 1.0 Yleinen -lisensseillä.
- Voit:
- jakaa – kopioida, levittää ja esittää teosta
- remiksata – valmistaa muutettuja teoksia
- Seuraavilla ehdoilla:
- nimeäminen – Sinun on mainittava lähde asianmukaisesti, tarjottava linkki lisenssiin sekä merkittävä, mikäli olet tehnyt muutoksia. Voit tehdä yllä olevan millä tahansa kohtuullisella tavalla, mutta et siten, että annat ymmärtää lisenssinantajan suosittelevan sinua tai teoksen käyttöäsi.
- jaa samoin – Jos muutat tai perustat tähän työhön, voit jakaa tuloksena syntyvää työtä vain tällä tai tämän kaltaisella lisenssillä.
Voit valita haluamasi lisenssin.
Tiedoston historia
Päiväystä napsauttamalla näet, millainen tiedosto oli kyseisellä hetkellä.
| Päiväys | Pienoiskuva | Koko | Käyttäjä | Kommentti | |
|---|---|---|---|---|---|
| nykyinen | 11. huhtikuuta 2007 kello 13.22 | | 600 × 480 (27 KiB) | Chrtsta | == Summary == {{Information |Description= Graph of logarithmic functions in SVG-format. Red is log(x) base 1.7. Green is log(x) base 2. Blue is ln(x) (log(x) base e). Cyan is log(x) base 0.5. I made this graph in gnuplot (post-processed using Inkscape) |
| 26. maaliskuuta 2007 kello 23.24 |  | 597 × 396 (29 KiB) | Dicklyon | Improve it by hand. Use base 10 in place of base 1.7. | |
| 17. maaliskuuta 2007 kello 14.32 |  | 600 × 480 (25 KiB) | Chrtsta | == Summary == {{Information |Description= Graph of logarithmic functions in SVG-format. Red is log(x) base 1.7. Green is log(x) base 2. Blue is ln(x) (log(x) base e). Cyan is log(x) base 0.5. I made this graph in gnuplot (it is post-processed using Ink | |
| 16. maaliskuuta 2007 kello 20.40 |  | 600 × 480 (18 KiB) | Chrtsta | Graph of logarithmic functions Red is log(x) base 1.7. Green is log(x) base 2. Blue is ln(x) (log(x) base e). Cyan is log(x) base 0.5. I made this graph in gnuplot, with these instructions: set terminal svg set output "logarithm.svg" set title "Graph o |
Tiedoston käyttö
Seuraava sivu käyttää tätä tiedostoa:
Tiedoston järjestelmänlaajuinen käyttö
Seuraavat muut wikit käyttävät tätä tiedostoa:
- Käyttö kohteessa nn.wikipedia.org
- Käyttö kohteessa no.wikipedia.org
- Käyttö kohteessa pl.wikipedia.org